|
Valery Milykh |
Dmitry Vavilov |
Ivan Platonov |
Alexander Anisimov |
Abstract—Smart Home products spread is restrained by fears of the personal data security. “Offline” solutions (partly or completely disconnected from the external operating signals and observations modules) protect privacy but have some disadvantages. Previously suggested methodology for analysis of the householder’s behavior and simulation of his activities provides improvement of the user needs predictions. In this paper the results of primal tests of this approach are presented and analyzed.
Index Terms— personal data security, recommender system.
I. Introduction
At least dozen of the productized Smart Home solutions were presented in frames of IFA 2015 Exhibition in Berlin last September. They are already available for consumers in the USA and EU countries. However, several significant obstacles slow down their promotion, and fear of the personal data security remains one of the most important. According to research [1], “consumers are more worried about privacy and security issues than any other potential downsides of the Internet of Things, with 53 percent expressing concern that their data might be shared without their knowledge or approval, and 51 percent expressing concern that their data could be hacked by other users”.
For example, widespread deployment of smart devices connected to some centralized data storage has broadened the scope of people who have access to logs of activities of thousands and even millions of users. As Smart Grid analytics report, “a utility in a major metropolitan area installed uni-directional smart meters that simply watched power usage on a "real time" basis. The CEO of the utility said that even though they weren't looking for personal information, it quickly became apparent that the utility could tell when people woke up, went to work, showered, cooked breakfast or dinner, and when they were on vacation.” [2]
So the user can require that managerial inputs, schedule of turning on/off the appliances, and information from sensors should not be visible for external observers. At the same time such “offline” or “disconnected” Smart Home has some disadvantages. For example, quality of prediction of user needs by separate recommender system is deliberately below in comparison with collaborative ones [3].
In our previous research papers [4,5] we considered how to improve the quality of the householder’s activities forecast by taking into account
1) Cyclicality of the Smart Home related user activities (at least daily and weekly cycles);
2) The forgetting factor in probabilistic calculations (probability of the similar user’s actions is higher if the time interval in days between them is less).
3) Duration and time of the start of the user’s activity as quantitative and qualitative estimation of his/her needs and preferences.
Based on these assumptions, our research team suggests the methodology for analysis of Smart Home user behavior and simulation of the householder’s activities in automatic mode. It shall be implemented as an additional module, a part of the Smart Home base software [4]. Input data for this module should be gathered from all available sources (info from sensors or explicit user’s directions), and the results of analysis will be applied to all supported features(including but not limited by security and healthcare topics, energy consumption optimization, and so on). Below the results of primal tests of the approach are discussed.
II. Task and Test Data Description
We consider user behaviour prediction regarding the following task: proactive setup of the comfort climate in the open space before the first employee arrives to the office. The personal does not have strict schedule for visiting the office during the working days. The sensors track the people moving inside the open space (but do not react on minor motions, so the log does not contain “white noise” data).
The log is gathered during one month. It is necessary to predict the time when the first employee comes to the office next working day (so the air conditioner might be turned on before it, and the necessary climate is arranged till the first person comes in). We simplify the task as much as possible (for example, we do not consider different air conditioning modes that can be setup by different persons in different days; we suppose that only one mode is used).
The log structure is very simple, every record includes date, time (hours, minutes, and seconds), and the motion indicator (0 or 1, “zero” records state lack of motion).
III. Test Data Clustering
The preliminary analysis shows that only “no motion” records are gathered for non-working days and the night time. To exclude artificial improvement of the algorithm [4] usage, we consider only records for working days since 6 AM till 8 PM. So data clustering takes place.
Weekly cyclicality of the users’ activities should improve the prediction for appropriate days of week (for example, we can expect that log of Thursday actions provides more reliable prediction for next Thursday). However due to fact that some non-working days were Monday and Tuesday (Russian national holidays), they were excluded from the clustered data, and weekly cyclicality of the users activities is broken. At the same time, it is a relatively common failure of the working days schedule, and it is necessary to have relatively long log of data to disregard such data interruption. In this case the weekly cyclicality is neglected because of short log of data.
IV. Test Results Analysis
The prediction algorithm is described in details in [4]. We divide the considered time frame (6 AM – 8 PM) on intervals in N minutes. For every interval of the specific day we consider the motion indicator equal to 1 for the whole interval, if motion is indicated at least once during this period of time. So we get values of the motion indicator for each interval for every day in our log (they are mentioned below as “actual”).
We take the first K days of the log (here K is the size in days of the “rolling window” of data). For each interval we calculate the predicted value of the motion indicator for K+1 day (based on steps defined in [4]) – and compare it with its “actual” value.
Then we repeat this procedure for prediction of the motion indicator’s values for K+2 day (based on data for K days since the second day in the log) and again compare the predicted and actual values. And reiterate the process as long as the size of log allows it.
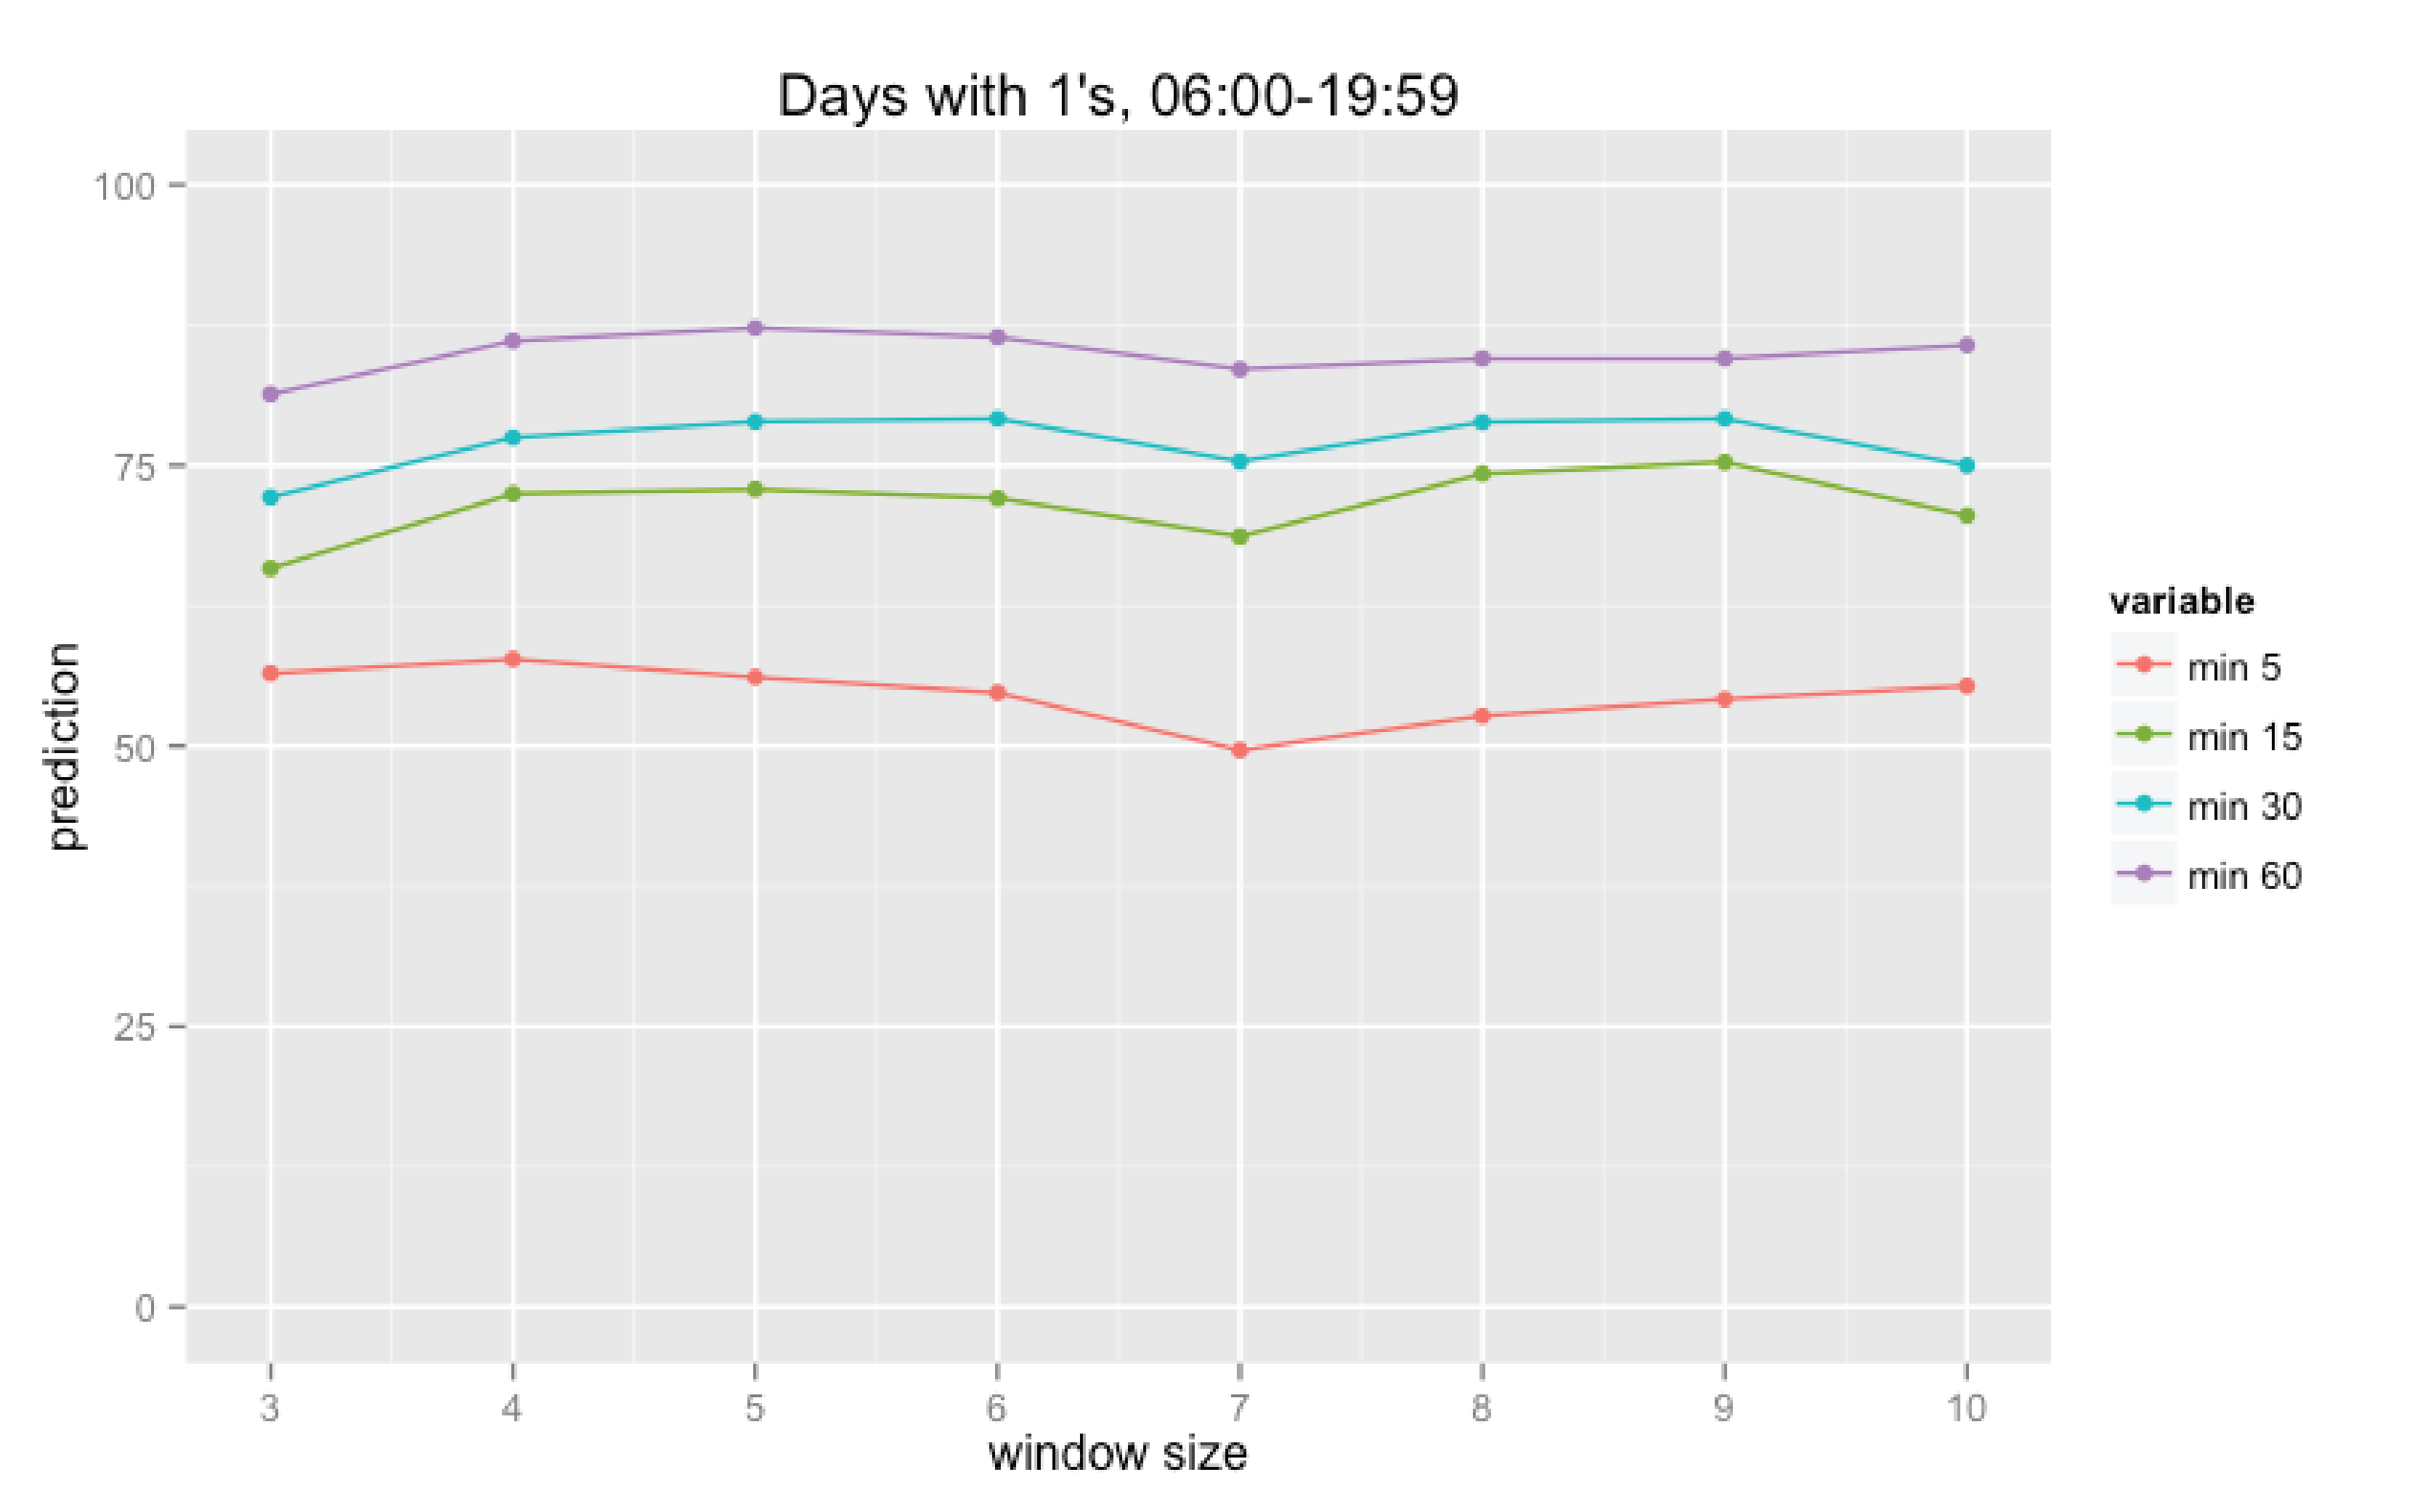
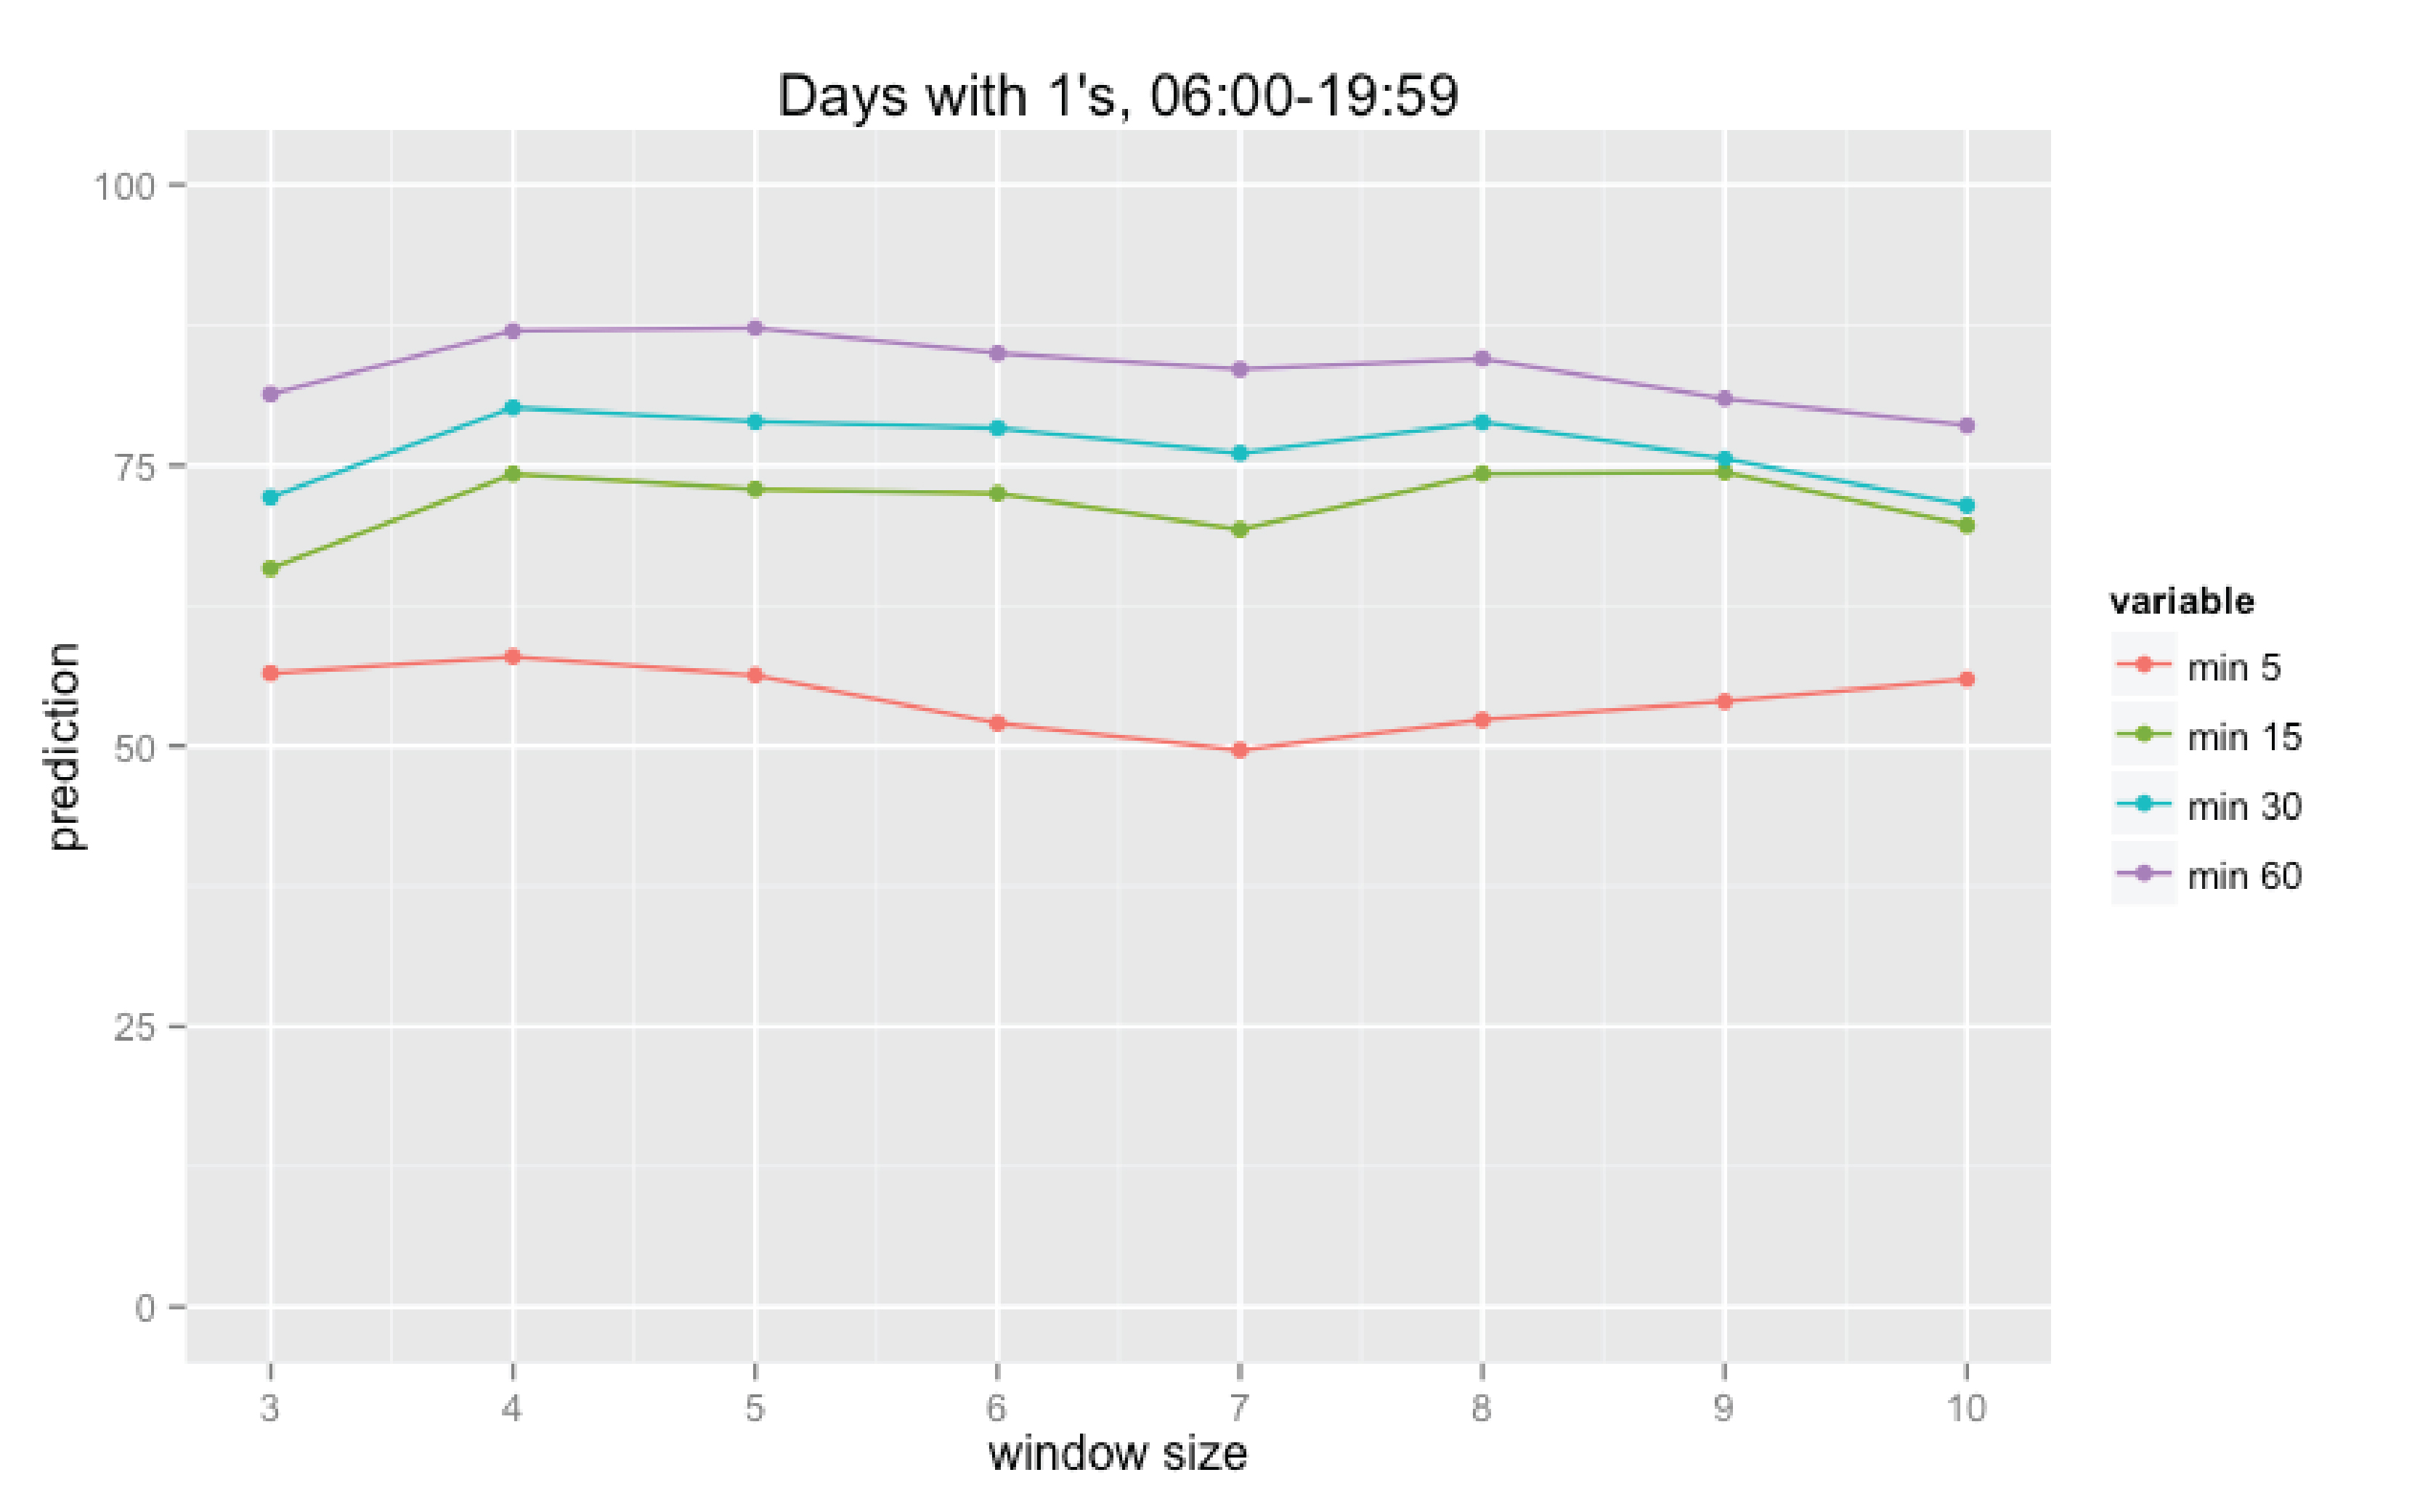
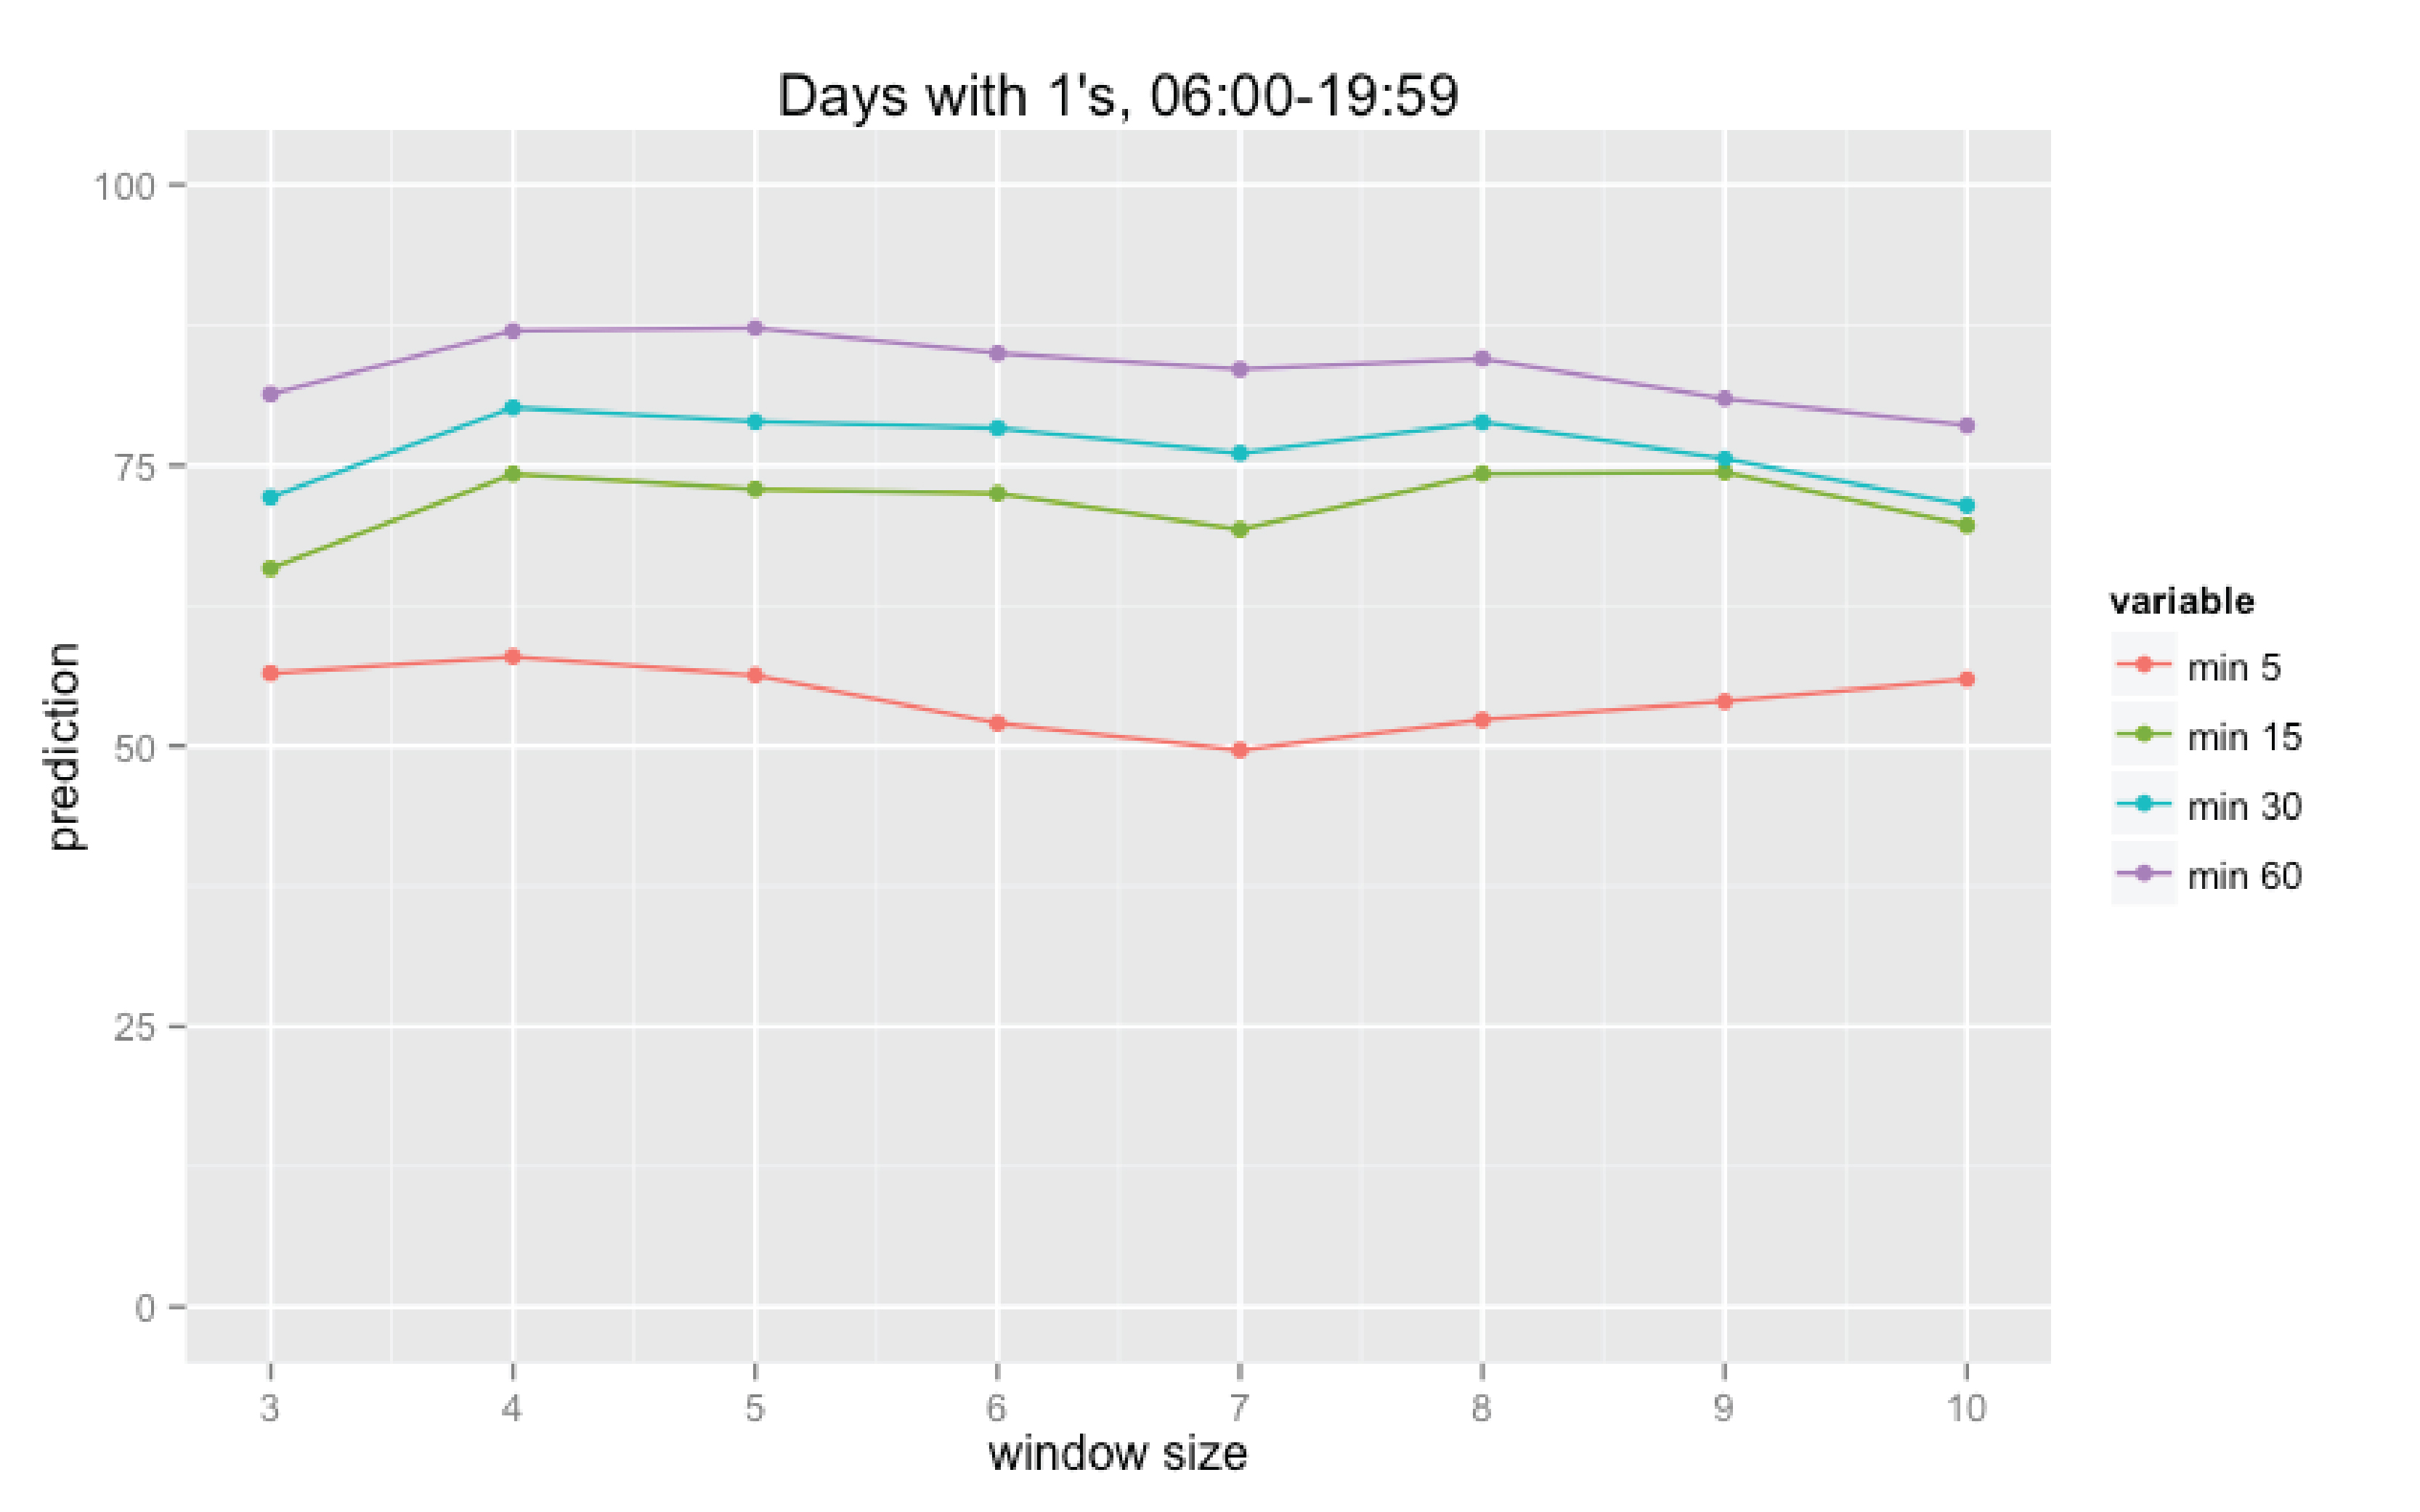
Finally we calculate the percentage of coincidences for all days and all intervals for the specific set of parameters used in these calculations: size of time interval (N minutes), “rolling window” size (K days), and the type function used in the forgetting factor calculation (linear, quadratic, or cubic; it defines how significant will be impact of the most recent data). The results are partly presented on the diagrams below.

Fug. 1 Prediction results for the linear forgetting factor dependency

Fug.2 Prediction results for the quadratic forgetting factor dependency

Fig.3 Prediction results for the cubic forgetting factor dependency
V. Conclusions
We can make several conclusions regarding influence of each of the mentioned above parameters. First of all, increase of the time interval’s size predictably leads to the prediction improvement. Secondly, increase of the “rolling window” size does not definitely improve the prediction. And finally, the type of dependency used for calculation of the forgetting factor does not significantly affect the prediction.
References
[1] THE INTERNET OF THINGS, Afinnova Research report, December 2014
[2] Interview with Samuel Sciacca, IEEE Smart Grid Website, http://smartgrid.ieee.org/questions-and-answers/551-interview-with-samuel-sciacca, 2014
[3] Alexander Felfernig, Michael Jeran, Gerald Ninaus, Florian Reinfrank, and Stefan Reiterer, Toward the Next Generation of Recommender Systems: Application and research Challenges, Multimedia Services in Intelligent Environments: Recommendation Services, Springer, 25:1-18, 2013
[4] Dmitry Vavilov, Alexey Melezhik, Ivan Platonov, “Reference Model for Smart Home User Behavior Analysis Software Module”, ICCE-Berlin 2014, Sep. 7-10
[5] Dmitry Vavilov, Alexey Melezhik, Ivan Platonov, “Imitation of Smart Home User’s Presence”, SHUR 2015, Malaga, Spain, June 22-25